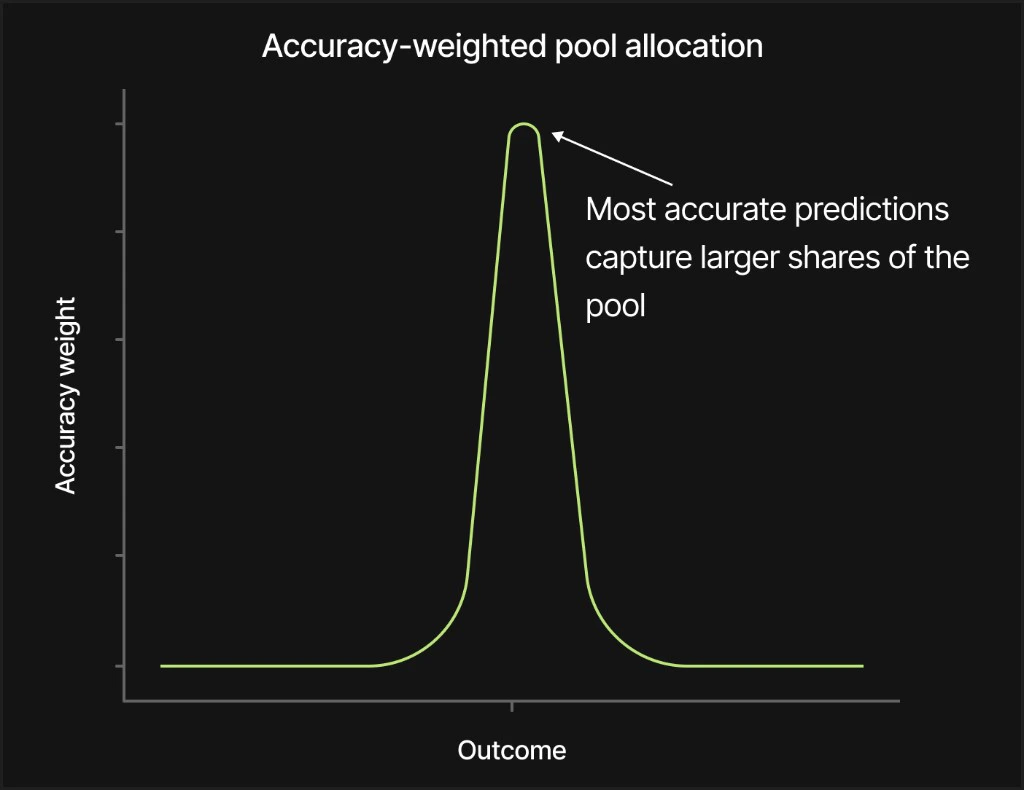
Among winners, the closer you were to the outcome, the larger your share of the prize pool. The system compares your to the and assigns a weight; better predictions get a higher weight. The curve is steep—a small edge among winners can move a lot of dollars. Dollar tables: Payout overview; then Capped proportional payout applies the per-round profit ceiling.Documentation Index
Fetch the complete documentation index at: https://docs.trepa.io/llms.txt
Use this file to discover all available pages before exploring further.
Formulas (for verification)
- Normalized error (your error vs median): , where is your error and is the median error.
- Accuracy weight: with exponent . Currently . Closer predictions have smaller and higher .